Most advice about data analytics for startups starts with a shopping list: pick a warehouse, connect a dashboard, then become data-driven. That sequence gets expensive fast. Before buying anything, build a small measurement system in a spreadsheet: one outcome the company needs, a few metrics that explain it, an owner for each, and a decision attached to every number.
The hard part isn't collecting events. It's deciding what to do when the numbers move, and making sure the numbers are trustworthy enough to act on.
Analytics cannot rescue a startup from weak demand or poor economics. Its value is narrower and more practical: it can help a team recognize trouble while there is still time to respond. In an analysis of 431 venture-backed companies that shut down, CB Insights identified running out of capital in 70% of cases, poor product-market fit in 43%, bad timing in 29%, and unsustainable unit economics in 19% (CB Insights account of the startup study). Cash running out is often the last visible symptom. Weak demand, inefficient acquisition, or poor customer economics may have been eroding the runway earlier.
A useful metric points to a decision. If signups hold steady while fewer users reach a meaningful product milestone, the team can examine onboarding or product friction. If a channel brings customers who churn quickly, the growth lead can reassess its targeting or spending. A number that changes no one's next action is reporting, not decision support.
Analytics adoption does not guarantee better survival or results for young companies. Measurement takes time and resources to maintain, and complexity can outweigh its value when a team cannot use the findings. For startups that can act on the information, analytics can still support better choices about product scope, pricing, targeting, and spending. The trade-off is straightforward: invest in measurement only when its likely decisions justify the work.
Before buying a tool, write down three answers:
If those answers are unclear, start with a spreadsheet and a small set of decision-linked measures. Add tooling when the existing process can no longer support the decisions the team needs to make.
Start with the business outcome you can't afford to misunderstand. Then add only enough measurement to explain it. A spreadsheet is a perfectly good starting point if the team can keep its definitions consistent and use the results in recurring decisions.
Name one north-star outcome. Choose a result that reflects real customer value, not just activity. For a product-led startup, that could be weekly accounts completing their first export. Write the decision it informs beside it, such as whether to simplify onboarding or invest in another acquisition channel.
Choose three to five input metrics. Select measures that plausibly move the outcome. A small funnel might include signup-to-export completion, trial-to-paid conversion, and customer acquisition cost by channel. If a metric can't help explain or influence the north star, leave it out for now.
Define every metric in a shared dictionary. Record its numerator, denominator, time window, event names, and exclusions. For example, say whether “export completion” counts an account's first successful export or every export, and make sure two people applying the definition get the same result.
Give each metric one owner. The owner checks that the number is accurate and raises it in the weekly review. A product lead might own export completion, while a growth lead owns channel-level acquisition cost. Shared responsibility often turns into no responsibility.
Set a threshold and action. If the export-step rate falls below its four-week average, the owner might check for a release issue and inspect the affected user journey before changing onboarding. A threshold should trigger a defined investigation or decision, not an automatic reaction to noise.
Keep the tracking plan small enough to maintain. Instrument only the events those metrics require, and build the first version in a spreadsheet before purchasing a warehouse or AI query tool. A practical test is simple: if you can't name both the decision and the owner, drop the metric.
Start with a compact set of measures that connects product behavior to acquisition economics. The formulas and monthly review recommendation for customer acquisition cost and lifetime value follow the SaaS KPI framework from Financial Models Lab.
| Metric | Formula | Worked example | Review cadence |
|---|---|---|---|
| Step conversion | Users completing step / users entering step | 1,000 signups, 600 exports = 60% | Weekly |
| Overall signup-to-subscription | Subscriptions / signups | 120 of 1,000 = 12% | Monthly |
| Customer acquisition cost (CAC) | Total sales and marketing spend / new customers | $30,000 / 100 customers = $300 | Monthly |
| Customer lifetime value (LTV) | ARPU × gross margin % / monthly churn rate | $100 × 80% / 5% = $1,600 | Monthly |
| LTV:CAC ratio | LTV / CAC | $1,600 / $300 = 5.33:1 against a 3:1 benchmark | Monthly |
For a product-led funnel, measure the steps between the first visit and a paid subscription, rather than treating signups as success. In this example, 60% of signups complete an export, and 20% of those exporters subscribe, producing an overall signup-to-subscription conversion of 12%. The export step is a useful first place to investigate because it sits between signup and payment and shows where users are dropping out. If product-market fit is still uncertain, use this guide to evaluate startup product-market fit alongside funnel measures, so activity isn't mistaken for durable demand.
Two habits keep these numbers usable:
LTV is a model, not a directly observed fact. The margin-and-churn formula assumes those inputs describe a customer's future economics; check that the churn measure and revenue period match, and don't use the resulting ratio as a substitute for examining channel quality and retention.
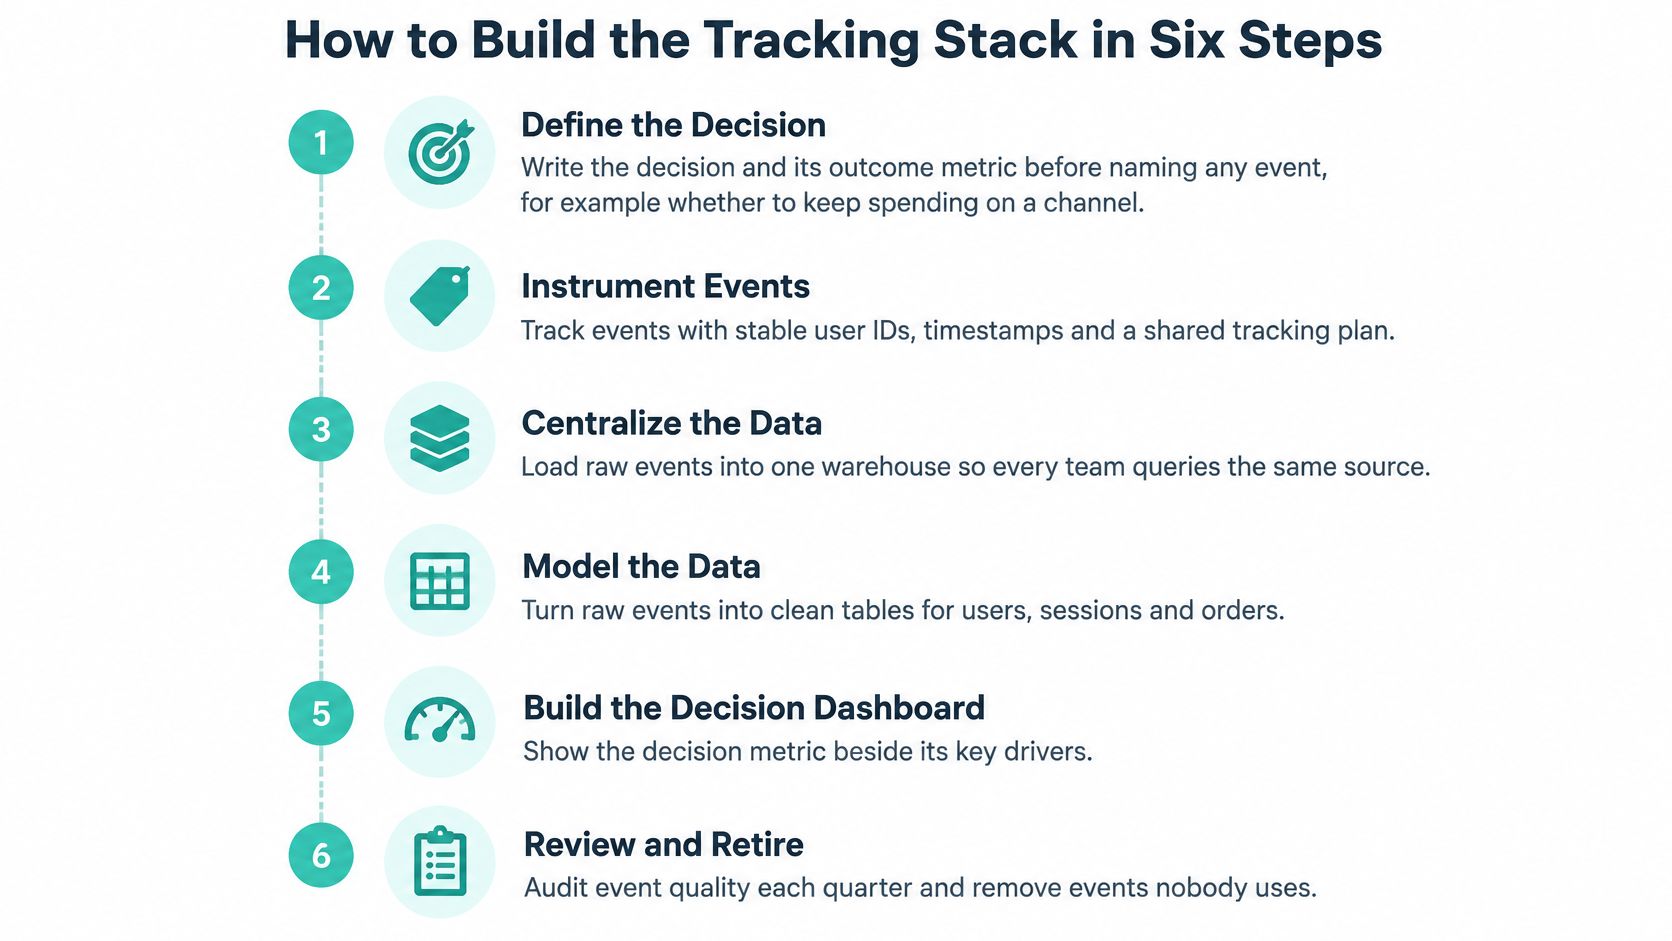
A trustworthy stack begins with an operating question, not an event catalog. These steps keep the data useful as the company adds sources and more people rely on its metrics.
Define the decision. Write down the choice and its outcome metric before naming events. For example, decide whether to keep spending on a channel based on the number of qualified customers it produces, not clicks alone.
Instrument events. Use stable user or account IDs, timestamps, and a shared tracking plan that defines each event and its properties. If an event name changes meaning between releases, later comparisons become difficult to interpret.
Validate incoming data. Check schemas, missing values, duplicates, and event order. Set an alert for a sharp drop in daily event volume, since a broken tracking call after a release can look like a sudden change in customer behavior.
Preserve raw events and test transformations. Keep raw events unchanged, then build versioned models with checks for primary-key uniqueness and data freshness. Tests make it easier to find whether a discrepancy comes from collection, transformation, or the metric definition.
Assign ownership and retention rules. Name an owner for each critical dataset, document where it lives and who can access it, and use role-based permissions. A startup data governance framework gives examples of retaining usage events for 12 months, support tickets for 3 years, and payment records for 7 years where legal obligations require it, as well as deleting personal data within 30 days of a valid request. Those periods aren't universal legal rules. Map each dataset to your own contractual and regulatory duties, record the choice, and automate approved deletion schedules.
Analyze by cohort and keep outcomes distinct. Segment by signup month, channel, plan, and geography instead of relying on aggregate retention, which can hide weaker results among newer users. Track engagement, customer retention, and revenue retention separately. Frequent use doesn't necessarily mean a customer stays or spends more.
Two other failure modes deserve attention: survivorship bias, where the team examines only customers who remain, and changing a product definition midway through a time series. Keep definitions stable, document unavoidable changes, and avoid treating unlike cohorts as directly comparable.
Practical rule: A weekly review should show each metric's current value, the decision it informs, and the action taken.
Choose tools according to the question the team needs to answer and the work it can maintain. The table shows a practical progression, not a checklist every startup must complete.
| Layer | Typical options | Add it when | Common mistake |
|---|---|---|---|
| Spreadsheet | Google Sheets, Excel | First paying customers; questions can still be answered by hand | Manual copy-paste nobody repeats |
| Product analytics | Amplitude, Mixpanel, PostHog | Funnel and retention questions need event-level data | Buying seats before a tracking plan exists |
| Warehouse and transformation | BigQuery, Snowflake, Postgres replica with dbt | Several sources or governed metrics need to be combined | Models with no named owner |
| BI dashboards | Looker Studio, Metabase, Tableau | Several people need to read the same numbers | Dashboards with no decision attached |
| AI query layer | Natural-language BI on governed models | Trusted datasets and owners exist | Answers without source tables or freshness shown |
Tool choice won't solve a shortage of data capability. In a 2025 global technology-leader survey, the leading data-strategy obstacles included difficulty finding skilled data talent (39%), obtaining timely fresh data (38%), tracing data lineage (34%), and security complexity (33%), according to the MIT Technology Review Insights and Databricks report. A natural-language interface can make it easier to ask a question, but it can also make a flawed metric sound authoritative.
Require any AI-generated answer to identify its source tables, data freshness, metric definition, population, and known limitations. It should distinguish a descriptive answer, such as “conversion fell,” from a causal claim, such as “the redesign caused conversion to fall.” Those claims require different evidence, and a fluent summary doesn't bridge the gap.
For a closer look at how companies assemble tools and systems, see this overview of an early-stage technology stack.
Pick the layer that answers this quarter's decision, not the one a conference talk recommended.
The fastest way to misuse an experiment is to stop as soon as the chart looks favorable. A positive fluctuation is not proof that a change worked, and repeatedly checking results can encourage a team to call a winner before the evidence is stable.
A commonly used default is 90% statistical significance, which corresponds to accepting a 10% false-positive rate. But confidence is only one part of the decision. The experimentation guidance from Optimizely on test duration and statistical power also emphasizes the importance of effect size and explains that the relationship between sample size and power follows a square-root pattern: increasing users by 10,000 times raises the relevant power term by only 100 times.
Before launch, define the smallest improvement worth acting on. If signup conversion is 4%, a team might decide that a move to 4.5% would justify the change, while a smaller lift wouldn't cover the implementation and maintenance cost. Use the baseline and that minimum worthwhile lift to set a sample-size target; don't borrow a universal visitor count from another product.
A tiny lift can be statistically persuasive and still have little commercial value. A large lift can be meaningful but require more observations than a small startup expects. A rushed test with weak assignment or unclear exposure won't become reliable just because the team waits longer.

Before starting a test, write down:
Don't hire for a job title before you know which recurring work needs an owner. The first deliverable should solve a real operating problem, not create a stream of dashboards that no one uses.
| Role | Hire when | First deliverable | Trap to avoid |
|---|---|---|---|
| Founder-owned analytics (no hire) | Before the first recurring decisions | Metric dictionary and weekly review | Founder time lost to dashboard upkeep |
| Data analyst | A product or growth team asks the same questions weekly | Funnel and cohort reports tied to decisions | Ad hoc requests with no owner |
| Analytics engineer | Definitions break across two or more sources | Tested transformation models | Hiring before instrumentation exists |
| Product analyst | Roadmap depends on experiment readouts | Experiment analyses and event audits | Strong SQL but weak product sense |
| Data scientist | Churn or forecasting models are needed and basics are stable | Validated predictive model | Expensive for descriptive work |
A data analyst should be able to clarify a denominator, find a broken event, and explain what a result does and doesn't establish. An analytics engineer becomes valuable when several sources need consistent definitions and tested transformations. A data scientist is a poor first hire if the core problem is that basic product events are missing or nobody owns the weekly review.
When you're ready to hire, Underdog.io's guide to hiring a data scientist can help clarify the role. Underdog.io is a hiring marketplace for early-stage tech talent and can help a founder build a shortlist to interview; for an urgent contract search, a staffing firm such as nexusITgroup.com can run the search.
Use interview prompts that reveal judgment, not just tool familiarity:
A short weekly review keeps analytics connected to work instead of turning into another reporting obligation. Product should receive activation and step-conversion measures; growth should receive CAC, LTV:CAC, and channel cohorts. Give every metric one named owner so the team knows who will investigate a change.
Use a 30-minute meeting to compare each metric with its last value, take or defer one decision, and record the decision with its expected outcome. That record lets the team check later whether the call worked. If your team also tracks search performance, a guide to building customizable SEO dashboards can help organize reporting around measures people use.
At each quarter's end, retire metrics that haven't informed a decision. Extra instrumentation creates upkeep; if no one maintains the definition or acts on the result, the measurement is adding work without adding clarity.
This week:
A metric that changes no decision is a cost, not an asset.
Underdog.io connects startup founders and hiring teams with curated tech talent, helping them find candidates across product, engineering, design, data, and other roles. If your measurement plan has clarified the analytics capability you need, visit Underdog.io to explore a hiring marketplace built for startups.