For years, recruiting success came down to two simple numbers: speed and cost. But hiring fast and cheap often backfires, creating expensive problems when a mismatched employee hurts team morale and tanks productivity. Quality of Hire (QoH) flips the script, offering a smarter way to measure the long-term value a new person actually brings to your company.
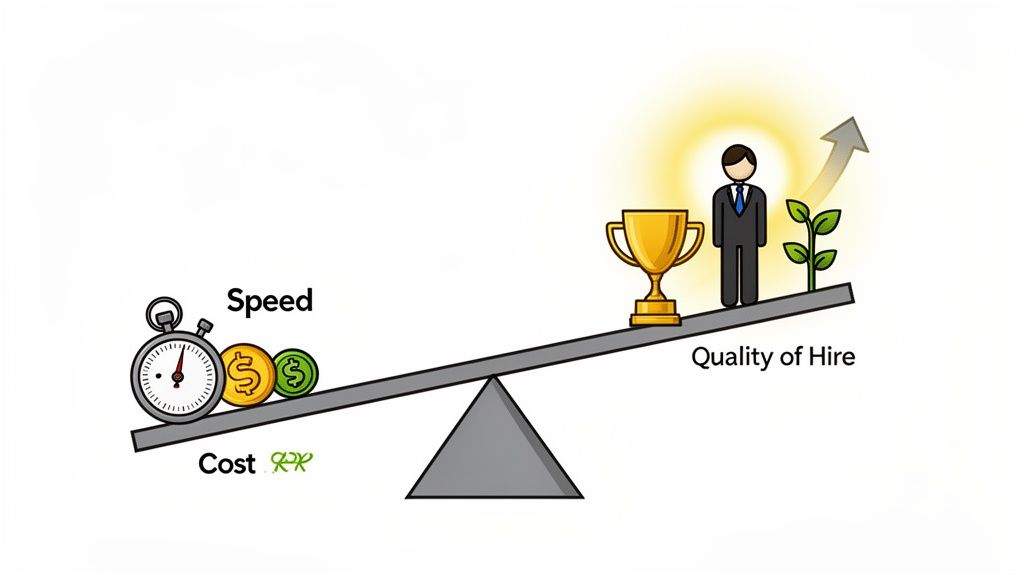
Think of old-school hiring metrics like time-to-fill and cost-per-hire as a sprinter's race. They tell you how quickly you crossed the finish line—getting a role filled—but they say nothing about whether you hired the right person for the long journey ahead. A fast, inexpensive hire who underperforms or leaves within six months is a net loss, plain and simple.
This guide is all about making a strategic shift toward quality of hire metrics, the ultimate measure of a new employee’s long-term impact. The best talent acquisition teams now live and breathe QoH because it ties hiring directly to real business outcomes.
When you start focusing on quality, recruiting stops being a cost center and becomes a strategic part of the business. It finally answers the most important question: "Did this hire make our company better?"
This approach helps you see the true ripple effect of your hiring decisions, connecting them to things like:
This isn't just a trend. Recent industry benchmarks show a whopping 31% of staffing agencies now rank quality of hire as their top ROI metric. That's way ahead of cost-per-hire (19%) and time-to-fill (18%). The priorities are shifting for a reason.
Actionable Insight: Frame your recruiting efforts in terms of business value, not just speed. Instead of reporting "we filled the role in 28 days," report "our last three hires in marketing have contributed to a 15% increase in qualified leads this quarter."
While it’s still important to understand your recruitment cost per hire and track time-to-hire, these metrics don't tell the whole story. Shifting to quality-first measures requires a new mindset. It often means rethinking how you approach HR, which is a critical step to future-proof your HR management and support real, sustainable growth.
Measuring the quality of a hire can feel abstract, almost like trying to bottle lightning. It's easy to get lost in dozens of potential KPIs, but the best approach is to zero in on a handful of metrics that give you the clearest, most actionable insights. These five core metrics work together to paint a holistic picture of a new employee’s long-term value.
Think of these metrics as different camera angles on the same subject. One might capture their immediate performance, another their endurance, and a third how well they fit in with the rest of the cast. Together, they tell you the complete story.
This is the most direct measure of a new hire’s contribution. It cuts right to the chase and answers the fundamental question: "Is this person actually good at their job?" You're looking for objective proof that the hire is meeting or even exceeding the expectations set for their role.
This data usually comes from formal performance reviews, which are typically conducted at the 90-day, six-month, or one-year mark.
For a comprehensive resource on defining, tracking, and leveraging key performance indicators to boost retention and overall hiring ROI, delve into this article on Quality of Hire Metrics: How to Improve Retention, Performance, and Hiring ROI.
High turnover is a massive red flag and a clear sign of a poor-quality hire. A fantastic employee who walks out the door after just six months is, in the end, a failed hire. This metric tracks whether your new hires are sticking around for a meaningful amount of time, with the one-year mark being the standard benchmark.
Retention is a powerful indicator of job satisfaction, cultural alignment, and just how accurate your hiring process really is. A 12-month retention rate of 85% or higher is often considered a strong benchmark.
This metric, often called "ramp time," measures how quickly a new employee gets up to speed and starts delivering real value. A shorter ramp-up time means a faster return on your hiring investment and strongly suggests the candidate had the right foundational skills from day one.
Time to Productivity is the ultimate test of your onboarding and training effectiveness. It reveals how well you set new hires up for success and whether they were as skilled as they appeared during interviews.
The key here is to clearly define what "full productivity" means for each role. For a salesperson, it might be hitting their first quota. For an engineer, it could be shipping their first significant code commit, and for a support specialist, it might be closing their first ticket independently.
Nobody has a better view of a new hire's success than their direct manager. This metric captures their perspective on the hire's performance, team fit, and overall impact. It's a crucial qualitative check that balances the more objective, quantitative data.
A simple survey sent to the hiring manager at key intervals (say, 30, 60, and 90 days) can capture this information perfectly. A high satisfaction score is a great sign that your talent acquisition team truly understood the needs of the role.
This final metric looks at how well a new hire aligns with and adds to your company's values and work environment. This isn't about finding people who are all the same ("culture fit"), but rather people who enrich your existing culture ("culture add").
This is definitely the most subjective of the five quality of hire metrics, but it's critically important for long-term team cohesion and employee engagement.
To make this easier to digest, here’s a quick-reference table breaking down these five core metrics.
Tracking these five metrics gives you a powerful, multi-faceted view of your hiring success. By combining hard numbers like performance and retention with qualitative feedback on satisfaction and culture, you get a complete picture that goes far beyond a gut feeling.
Tracking individual metrics like retention or performance gives you useful snapshots, but combining them into a Quality of Hire (QoH) Scorecard tells a powerful, cohesive story. Think of it like a credit score for your hiring process. A single number can summarize a ton of complex data, making it easy for leadership to grasp the health of your recruiting efforts at a glance.
Creating a composite score turns raw data into strategic intelligence. Instead of just knowing you hired someone with a 4/5 performance rating, you can translate that into a single QoH number. This number lets you see trends over time across different departments, recruiters, or hiring sources. This is how you move from simply collecting data to making data-driven decisions.
First things first: you need to pick the metrics that actually matter to your organization. You don’t need a dozen. Starting with three or four of the heavy hitters we discussed earlier is a great foundation.
Next, you have to normalize the data. You’ll be mixing different types of data—like a performance rating on a 5-point scale and a retention percentage—so you need to get them all speaking the same language. A 100-point scale is usually the way to go.
Here's what that looks like in practice:
This breakdown shows the core pillars that typically form the basis of a quality of hire scorecard.
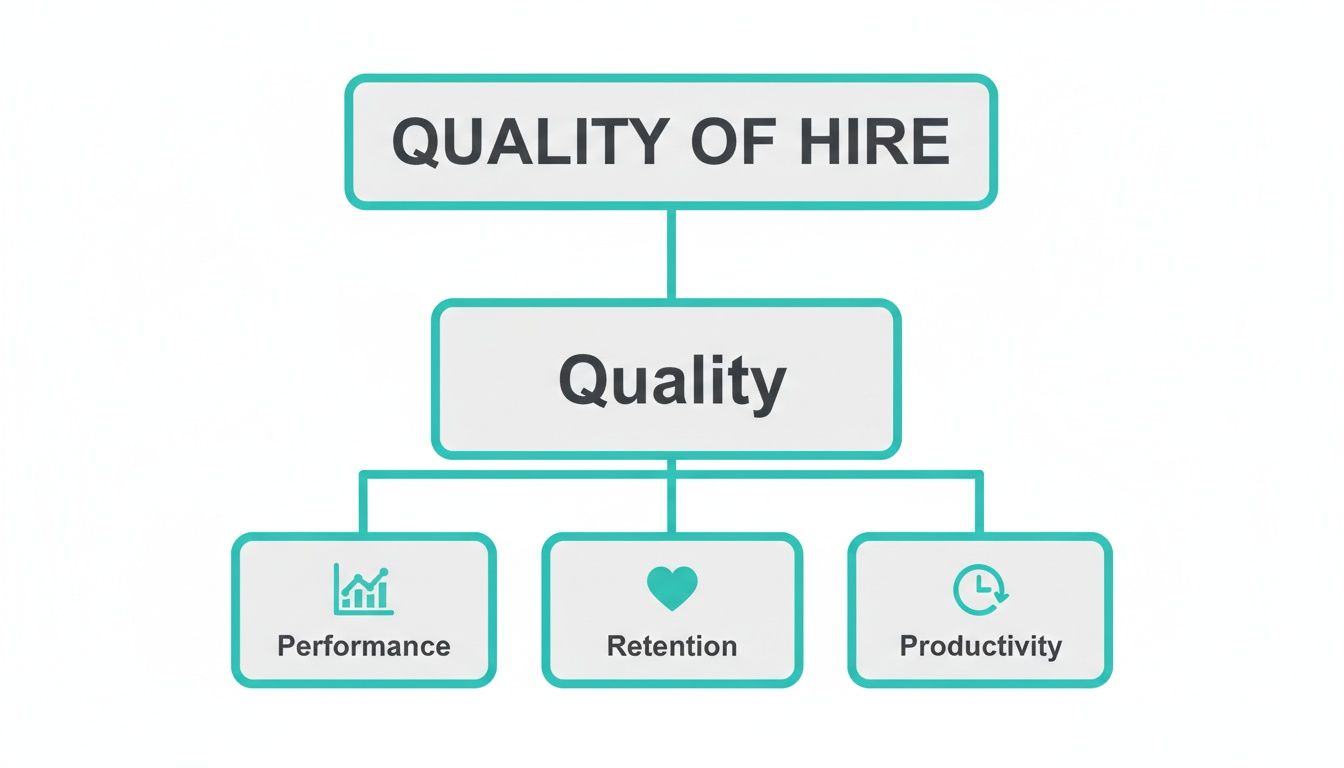
The visual makes it clear: overall hire quality is a product of multiple factors, with performance, retention, and productivity sitting at the heart of it all.
Not all metrics carry the same weight for every role. For a senior engineering lead, long-term retention and performance might be far more critical than a fast ramp-up time. For a short-term contractor, on the other hand, time to productivity could be the most important factor.
This is where weighting comes in.
Weighting lets you assign a different level of importance to each metric depending on the role’s strategic value. It ensures your final QoH score accurately reflects what "quality" truly means for that specific position.
Let's walk through a sample calculation for a new Product Manager:
In this scenario, the new Product Manager has a Quality of Hire score of 87.5. This single number is now a powerful tool. You can use it to compare against the average QoH for the product department, track the performance of the recruiter who sourced them, and analyze the effectiveness of the job board they came from.
Scaling this kind of process requires a system, and many teams find great value in exploring different hacks that will help you hire for scale to ensure consistency.
Collecting data is only half the battle. The real magic happens when you use that information to make tangible improvements to how you hire. Think of your QoH scorecard not as a final grade, but as a strategic roadmap for finding and retaining incredible talent.
With a system for measuring hire quality, you can finally move from gut feelings to data-backed decisions. This is where you connect the dots between the outcomes of your hires and the process that brought them through the door. The goal is to answer critical business questions with clarity and confidence.
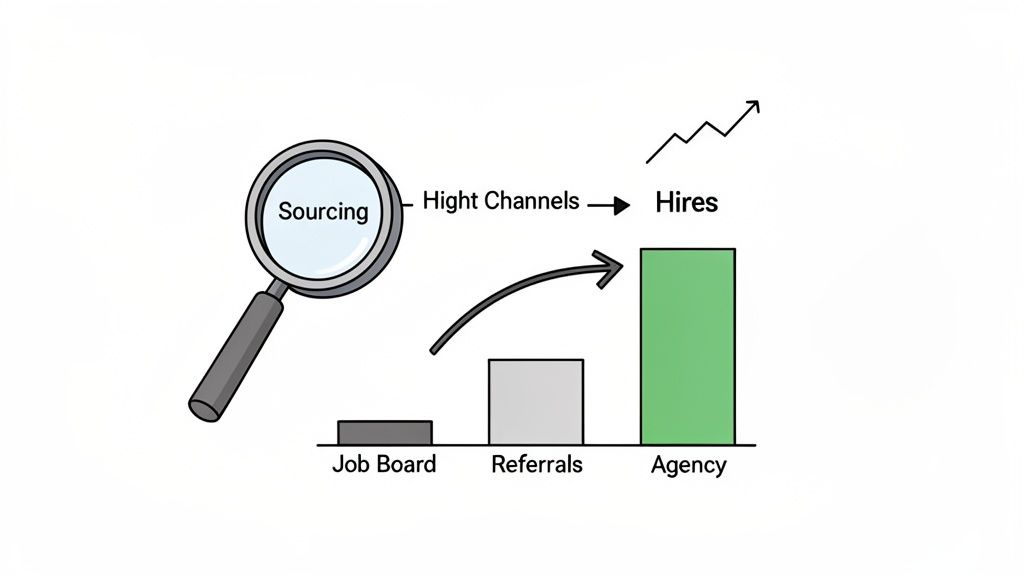
One of the most powerful ways to use QoH data is to figure out which of your sourcing channels actually work. Are the expensive job boards you're paying for delivering high-performers who stick around? Or are employee referrals truly your secret weapon for finding the best talent?
By breaking down your QoH scores by source, you can see which channels consistently produce quality hires and which are just draining your budget.
Here’s a real-world example. Imagine your data reveals these QoH scores by source:
This insight is a game-changer. It clearly shows that while you might be spending thousands on Job Board X, the hires it produces have lower performance and retention rates. The obvious move is to reallocate that budget toward a beefier employee referral bonus program or invest in better sourcing tools for your team.
Let's be honest: not all interviewers are created equal. Some are fantastic at spotting technical skills but miss crucial culture-add indicators. Others might consistently champion candidates who end up being high-quality, long-term employees. QoH data lets you see these patterns clearly.
By tagging new hires with the interviewers and panel members from their process, you can identify which individuals or teams just have a knack for spotting top talent.
Actionable Insight: This isn't about blaming individuals for bad hires. It's about identifying your most effective interviewers and learning from them. Their techniques can be used to train the entire team, lifting everyone's ability to make great hiring decisions.
For instance, if you notice that hires from panels including a specific engineering lead consistently have high retention and manager satisfaction scores, you can dig into that lead's interview notes. What questions are they asking? What qualities are they looking for? This feedback creates a powerful loop for continuous improvement.
Your quality of hire metrics also serve as the ultimate validation for any pre-hire assessments you use. Whether it's a coding challenge, a portfolio review, or a case study, you need to know if it actually predicts on-the-job success.
If you find that candidates who ace a particular assessment consistently end up with low QoH scores, that assessment isn't just ineffective—it's actively misleading your team. It’s time to ditch it.
Here’s how you can fine-tune your process:
Connecting this data is much easier with a well-integrated applicant tracking system. For example, a key benefit of a Greenhouse integration for companies is ensuring this seamless data flow, allowing you to link candidate data directly to post-hire performance metrics. This turns your quality of hire metrics into a dynamic, actionable tool for building a world-class team.
Jumping into quality of hire metrics is a huge step forward, but it’s rarely a straight line to success. Plenty of teams get tripped up by the same few hurdles, which can muddy their data and make the whole effort feel pointless. If you know what to look out for, you can sidestep these issues from the get-go.
One of the biggest traps is leaning too heavily on subjective feedback. While keeping hiring managers happy is obviously important, their satisfaction can sometimes be swayed by personal chemistry rather than pure performance. A manager might rave about a new hire who’s easy to get along with, even if their actual output is lagging.
The key is to balance that gut-check feedback with hard, objective data. You need to pair a manager's satisfaction score with concrete performance numbers—things like sales quota attainment, project completion rates, or code commits. This creates a much more complete and defensible picture of whether a new hire is truly succeeding.
Another classic mistake is a lack of standardization. If your sales team defines "fully ramped" as hitting quota in 90 days, but engineering uses a six-week milestone for shipping their first feature, you can't compare their "Time to Productivity." It's apples and oranges. This kind of inconsistency makes a reliable, company-wide view of hiring quality impossible.
The fix? Get in a room with department heads and agree on clear, consistent definitions for your key metrics before you start tracking anything.
Getting this consistency right ensures your quality of hire metrics are actually reliable. Your data transforms from a collection of disconnected opinions into a trustworthy source of truth.
It’s incredibly easy to get overwhelmed by all the potential metrics you could track. This often leads to "analysis paralysis," where teams spend so much time designing the perfect, all-encompassing system that they never actually start collecting any data.
The best way forward is to start simple. Seriously. Just pick one or two high-impact metrics that are easy to measure right now. For most companies, that means:
Once you have a solid process for these two, you can gradually layer in more sophisticated metrics like performance scores or ramp time. The goal is to build momentum, not a perfect system from day one.
Finally, any metrics initiative is dead in the water without leadership support. A common misstep is to frame QoH as a tool for critiquing past hiring decisions, which immediately puts managers on the defensive. Instead, position it as a forward-looking, collaborative tool for building a stronger company together.
There’s a huge gap between how important companies say QoH is and their ability to actually measure it. Surveys show that up to 89% of talent leaders believe it's a critical metric, yet only about 25% feel they can track it effectively. This is a massive strategic risk, especially when you consider that replacing an employee can cost anywhere from 20% to over 200% of their annual salary.
By highlighting these financial stakes and showing how QoH data can improve future outcomes, you can get the buy-in you need to make it stick. For a deeper dive into these challenges, you can learn more about measuring hire quality on jobylon.com.
Jumping into hiring analytics brings up a lot of questions, especially when you're just getting your feet wet. Here are some of the most common ones we hear about using quality of hire metrics, with practical answers to help your team get started.
Measuring quality of hire isn’t something you do once and forget about. It's a process. Since it’s a lagging indicator, you have to give new hires time to actually settle in and show what they can do. Measuring too early will give you a fuzzy, incomplete picture.
Think of it like checking on a tree you just planted. You wouldn't measure its growth an hour later. You check after a few months to see if it’s taken root, and again after a year to see how much it's really grown.
For a cadence that actually works, think in milestones:
This phased approach turns QoH from a one-off report into a continuous health check on your entire hiring process.
Tracking quality of hire is a team sport, plain and simple. While one department usually "owns" the process, the actual data and insights have to come from all over the company. One of the biggest mistakes is dumping this entirely on HR, which guarantees no one else will buy in.
The responsibility is best shared across a few key groups:
Real success in measuring hire quality comes from a solid partnership between HR and business leaders. When everyone has skin in the game, the data becomes a powerful tool for the whole company, not just another report that gathers dust.
You don’t need a huge budget or a fancy analytics suite to start measuring the quality of your hires. If you're a small business or a startup, the key is to start with what’s accessible and impactful. Trying to roll out a complicated five-metric scorecard from day one is just asking for a headache.
Instead, take a lean approach. Start with just two powerful data points you can track with simple, free tools:
Even with just these two metrics, you can start to see powerful patterns. Maybe you’ll find that hires from one source consistently get higher satisfaction scores, or that retention is way lower for roles filled by a certain agency. This simple starting point gives you a solid foundation you can build on as your company grows.
Yes, absolutely. Bias is one of the biggest risks you face when measuring hire quality, and you have to be deliberate about fighting it. If you don't, unconscious bias will seep into your data, leading you to the wrong conclusions and reinforcing unfair hiring practices instead of fixing them.
The risk is highest with the squishier, more subjective metrics. A hiring manager's "satisfaction" or a peer's feedback on "cultural fit" can easily be skewed by personal affinity—our natural tendency to like people who are like us.
Here’s how to actively reduce bias in your quality of hire metrics:
By taking these steps, you can build a QoH system that is not only insightful but also fair.
Finding the right talent is the first step toward improving your quality of hire. Underdog.io makes that step easier by connecting you with a curated pipeline of vetted tech professionals actively looking for roles at innovative startups.