Your top engineer looked close. The interviews were going well, the team liked them, and then day 38 hit. A competitor moved faster, the offer landed, and your process looked slow because it was slow. That's the problem with hiring speed, founders don't lose great people because they lack opinions, they lose them because they don't turn those opinions into decisions fast enough.
Time to Hire Metrics only matter when you treat them like a diagnostic, not a trophy. The number tells you how efficiently your funnel moves from first touch to accepted offer, but by itself it can hide rushed screening, bloated interviews, or weak follow-through. If you want a hiring system that gets better, you need to read the metric alongside quality signals and recruiter behavior, not in isolation.
A founder usually doesn't notice hiring drag until it costs them a person they wanted badly. The team has done the screens, the loop is finished, and the candidate has already gone quiet because a competitor made a cleaner, faster decision. Time to hire became a board-level topic because it shows whether your hiring engine is moving or stalling.
A tight number with bad outcomes is worse than a slower number with strong retention. Analysts at Josh Bersin Company and AMS summarized a global average of 43 days across roughly 250,000 hires, later framed as 44 days in 2023, which works out to about 6 weeks from application to accepted offer in many organizations. That backdrop matters because founders who only chase a lower number can end up compressing judgment, skipping signal, and paying for it later in churn. Josh Bersin Company and AMS benchmark summary
Time to hire shows whether your recruiting process is moving candidates through the pipeline without unnecessary delay. It does not tell you whether the candidate will stick, perform, or raise the bar. Strong teams treat it as one input in a hiring review, not the whole review, and they pair it with retention and quality signals so the number has context.
Practical rule: if a time to hire number looks great but first-year outcomes are getting worse, the process isn't healthy, it's just fast.
The spread by role makes the point even more clearly. One benchmark found tech roles averaging 23.4 days, while other breakdowns showed tech and media at about 20 days versus 67+ days for energy and defense. Specialized or heavily regulated roles routinely take 2 to 3 times longer than faster-moving tech roles, even in the same labor market. Role and sector benchmark spread
Founders should ask a better question: what is driving the number? A short time to hire with weak acceptance rates, poor retention, or low-quality interview feedback is a warning sign, not a win. If you want to understand what candidates value in the process, read what candidates actually care about.
A founder gets the same complaint in two different meetings. Recruiting says the pipeline is moving too slowly. Operations says the role stayed open too long. Those are related problems, but they are not the same metric.
Time to hire is the calendar days between when a candidate enters your pipeline and when they accept the offer. Depending on your process, entry can mean application, sourcing touch, or referral. Time to fill starts earlier, at requisition approval or job posting, and ends at hire or offer acceptance depending on your internal policy.
The distinction matters because one metric is candidate-centric and the other is organization-centric. Time to hire isolates pipeline execution. Time to fill captures upstream delays like headcount approval, manager sign-off, and job-posting lag. If you want to debug recruiter speed, time to hire is the sharper tool. If you want to understand total vacancy duration, time to fill belongs in the mix too. Greenhouse glossary definition, iCIMS comparison of the two metrics
Time to hire shows whether your recruiting process moves candidates through the pipeline without unnecessary delay. It does not tell you whether the candidate will stay, perform, or raise the bar. Strong teams treat it as one input in a hiring review and pair it with retention and quality signals so the number has context.
Practical rule: if a time to hire number looks great but first-year outcomes are getting worse, the process is fast, but it is not healthy.
The spread by role makes the point even more clearly. One benchmark found tech roles averaging 23.4 days, while other breakdowns showed tech and media at about 20 days versus 67+ days for energy and defense. Specialized or heavily regulated roles routinely take 2 to 3 times longer than faster-moving tech roles, even in the same labor market. Role and sector benchmark spread
Founders should ask a better question, what is driving the number? A short time to hire with weak acceptance rates, poor retention, or low-quality interview feedback is a warning sign, not a win. If you want to understand what candidates care about in the process, read what candidates care about.
Use this formula for time to hire:
Offer acceptance date minus first pipeline entry date = time to hire
If a candidate first enters your pipeline on March 3 and accepts on March 24, your time to hire is 21 calendar days. If your ATS captures application date, sourcing date, and referral date separately, choose one standard entry rule and keep it consistent across all roles. Mixing entry points without a rule makes the metric useless.
“Candidate entry first, offer acceptance last. Everything else is noise.”
That is the precision standard I'd put in a hiring playbook. It keeps the team focused on fixing the process instead of arguing about dates.
Here's the visual I'd put in front of a founder before they start asking for faster interview loops.
Time to fill starts at the business decision to open a role. Time to hire starts when a real candidate enters the process. That means the first one belongs in staffing and headcount planning, while the second one belongs in recruiting operations and candidate experience.
If your CEO says, “Why does this role take so long to hire?” the answer may be split across both metrics. Budget approval might be slow. The interview loop might be slow. Or both might be slow. The point is to separate the sources of delay instead of treating them as synonyms.
For a deeper lens on downstream outcomes, compare this definition with quality of hire metrics. The better your definition, the less garbage you'll get in your dashboard.
A single average can hide the problem. I've watched teams brag about a 20-day time to hire while finalists were dropping out, hiring managers were picking speed over judgment, and the eventual hire needed to be replaced. The number looked fine because the pipeline kept moving, but the business still paid for weak decisions. Pair time to hire with outcome data or you will optimize for the wrong thing.
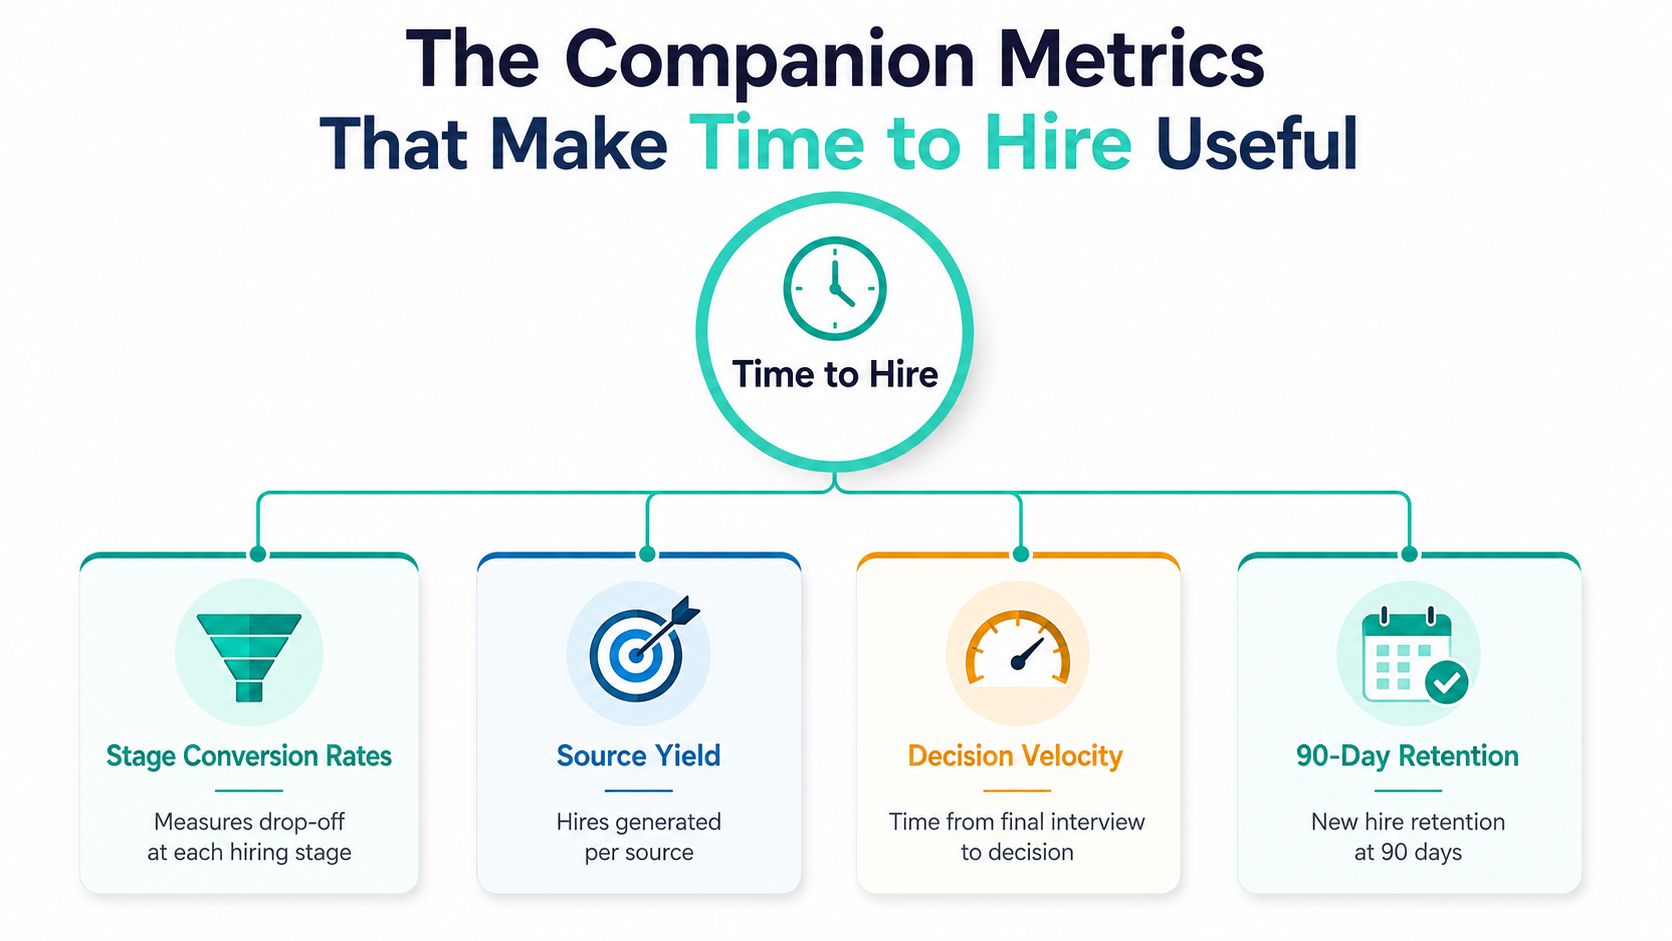
Stage conversion rates show where candidates fall out of the funnel. If people keep disappearing after the recruiter screen or the final interview, the issue is usually your evaluation process, not your sourcing.
Source yield shows which channels produce hires. A source that creates a lot of applicants and almost no accepted offers is noise, even if the volume looks impressive.
Decision velocity measures the time from final interview to decision. Startup hiring often stalls here because calendars, approvals, and committee behavior slow everything down.
90-day retention tells you whether the process produced a hire that sticks. It is the first honest check on whether speed created long-term value, and it belongs next to the speed metric, not somewhere else in the dashboard.
| Companion Metric | What It Answers | What It Exposes |
|---|---|---|
| Stage Conversion Rates | Where do candidates drop off? | Weak screens, poor interviews, slow follow-up |
| Source Yield | Which channels produce hires? | Low-value sourcing, wasted spend, bad targeting |
| Decision Velocity | How fast do teams decide? | Committee drag, schedule friction, indecision |
| 90-Day Retention | Did the hire last? | Rushed judgments, misalignment, weak screening |
That table is the difference between a dashboard and a vanity report. You do not need every metric on day one, but you do need a pair that catches both funnel health and outcome quality. If the funnel is leaky, start with stage conversion and decision velocity. If sourcing is the issue, start with source yield and retention.
The wrong interpretation is usually obvious once you look at the pairings. A process can be fast because recruiters are strong, or fast because the team stopped asking hard questions. Those are very different operating states, and only one of them scales.
For a tighter definition of downstream quality, compare this section with quality of hire metrics. Then use explore Faberwork's latest ideas to pressure-test how your team thinks about candidate quality versus pipeline speed.
Pull this from your ATS, not from a hand-built spreadsheet. Use the date a candidate entered your pipeline and the date they accepted the offer, then subtract one from the other. Segment the result by role family, source, recruiter, and month so the number shows you where the process is tight and where it is leaking.
Use cuts that explain behavior. Department, seniority, source channel, and recruiter usually reveal the bottlenecks. A single company average hides all of that. If engineering moves slowly and marketing moves quickly, you need to see it. If one recruiter moves twice as fast as another, you need to see that too.
Exclude candidates who withdrew for reasons outside your process if you are measuring controllable pipeline time. Otherwise, you pollute the metric with delays your team cannot fix. Keep the definition clean, or people stop trusting the dashboard.
Precision rule: measure the time you can influence, not every delay that touched the process.
| Segmentation Cut | When It Helps | When It Hides Signal |
|---|---|---|
| Role family | When engineering, sales, and ops behave differently | When used alone across a mixed hiring portfolio |
| Seniority level | When managers, ICs, and executives move at different speeds | When you need operational root cause detail |
| Source channel | When one channel produces faster or stronger candidates | When volume matters more than speed |
| Recruiter | When you want to compare workflow execution | When team complexity differs sharply |
If you want a practical operating model for funnel design, use explore Faberwork's latest ideas and adapt the parts that match your ATS setup. Do not copy the stack. Use the structure to make your own data answer cleaner questions.
Ask for the calendar days between first pipeline entry and offer acceptance, grouped by role family, source, recruiter, and month. Ask for median, not just average, if your system supports it. Ask for a clean filter that removes withdrawn candidates who never reached a decision point. That gives you a usable view without turning the team into spreadsheet clerks.
Benchmarks matter only if you read them correctly. A founder who copies a single average is making a bad call, because the useful range changes by role, seniority, and market pressure. Use benchmarks to calibrate your hiring system, not to copy someone else's number.
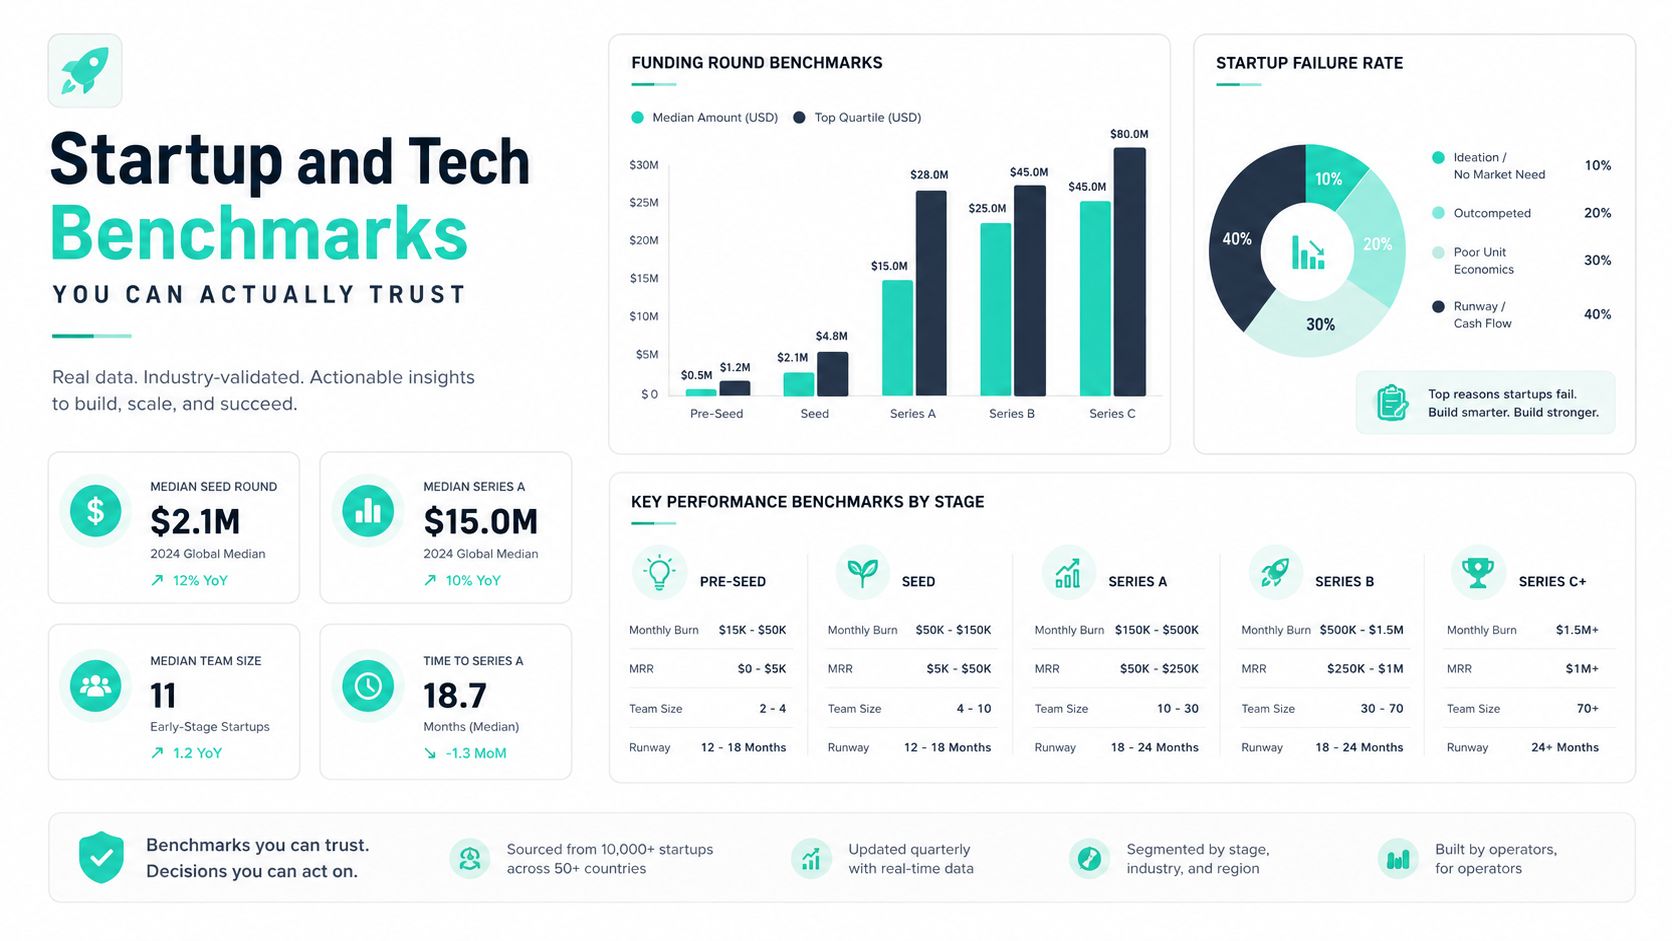
One benchmark puts the global average time to hire at about 23.8 days, while another reports a national median of 24 days, with the 25th percentile at 17 days and the 75th percentile at 36 days. That spread is the point. “Good” is not one number, it is a band, and your company should sit in the right part of that band for the roles you are filling. Hyring benchmark ranges
Role level changes the target even more. One benchmark source reports 14 to 21 days for entry-level and hourly roles, 21 to 35 days for professional individual contributors, 28 to 42 days for managers and supervisors, 42 to 60 days for directors, and more than 90 days for executive hires. If you run a startup, that should end the idea that one hiring-speed target fits every role. Role-level benchmark ranges
Sector differences are just as clear. Tech averaged 23.4 days in one benchmark, while another industry breakdown put tech and media at about 20 days versus 67+ days for energy and defense. Regulated and specialized teams should stop comparing themselves to consumer-tech hiring as if the work, approval process, and candidate pool were the same. The spread is wider than founders expect. Tech versus regulated-sector spread
The market is slower than many hiring teams want to admit. One 2026 report says average time to fill reached 63 to 68 days nationally in January 2026, nearly double the 36 to 44 days reported in 2023, and technical roles averaged 23.3 interview hours before an offer in Q1 2026. Long interview loops are part of the slowdown. If your process keeps stretching, your competitors will close candidates first. 2026 hiring speed report
I would not anchor a startup on one generic market report. Track the rolling 90-day median for each role family, then compare it with the role level and source mix you hire from. That keeps you from overreacting to a bad month and from ignoring a real slowdown.
Before any hiring review, ask one question: Are we comparing this role to the right peer group, or are we flattering ourselves with the wrong benchmark? If the answer is fuzzy, the dashboard is lying to you.
Fast hiring means little if the people you hire leave quickly or underperform. Slow hiring can also be a warning sign that your process is too heavy, your bar is vague, or your managers cannot make decisions. The useful view pairs time to hire with retention, offer acceptance, and source quality, then breaks the numbers out by role family so you can see where the system is healthy and where it is breaking.
For outbound-heavy teams, I would also pair hiring speed with pipeline quality metrics from Cold Email Metrics. The same logic applies. Speed without quality is noise, and quality without speed usually means you are losing good candidates before you make a decision.
Your ATS already has enough data to build a useful hiring dashboard. Stop waiting for a data warehouse project. Start with one clean time to hire view, one funnel view, and one source view, then make the team look at them every week.
Pull candidate_id, role_family, source_channel, recruiter_name, first_pipeline_entry_date, offer_acceptance_date, stage_name, stage_entered_at, and stage_exited_at into one table. From there, build three outputs that answer different questions.
, Median time to hire by role familySELECTrole_family,PERCENTILE_CONT(0.5) WITHIN GROUP (ORDER BY DATE_PART('day', offer_acceptance_date - first_pipeline_entry_date)) AS median_time_to_hire_daysFROM hiresWHERE offer_acceptance_date IS NOT NULLAND first_pipeline_entry_date IS NOT NULLGROUP BY role_familyORDER BY median_time_to_hire_days;, Stage conversion funnelSELECTstage_name,COUNT(DISTINCT candidate_id) AS candidates,COUNT(DISTINCT CASE WHEN stage_exited_at IS NOT NULL THEN candidate_id END) AS exited_stageFROM candidate_stagesGROUP BY stage_nameORDER BY stage_name;, Source yield tableSELECTsource_channel,COUNT(DISTINCT candidate_id) AS hiresFROM hiresWHERE offer_acceptance_date IS NOT NULLGROUP BY source_channelORDER BY hires DESC;That gives you the basic operating view. A startup analytics owner can surface it in Looker Studio, Metabase, or Hex with a trend line and a cohort heatmap. Put monthly median time to hire by role family on the top row, then add source and recruiter filters below it. Leaders need one place to check the hiring system without digging through raw exports.
Timezone normalization breaks date math fast. Candidate deduplication matters when the same person enters from two channels. Partial-month handling matters when you compare one short month to another. If your chart looks dramatic but the data model is sloppy, the chart is trash.
Operational note: dashboards fail more often from bad definitions than bad formulas.
If you run outbound-heavy hiring, pair this with Cold Email Metrics. For pipeline-building context, compare this approach with cut hiring costs with pipelines and Underdog.io's pipeline guidance. The point is simple, the funnel work starts before the role opens.
Ship one role-family median, one source yield view, and one stage conversion table first. Do not wait for perfect data. Put the dashboard in front of the team, then clean the inputs as people start using it.
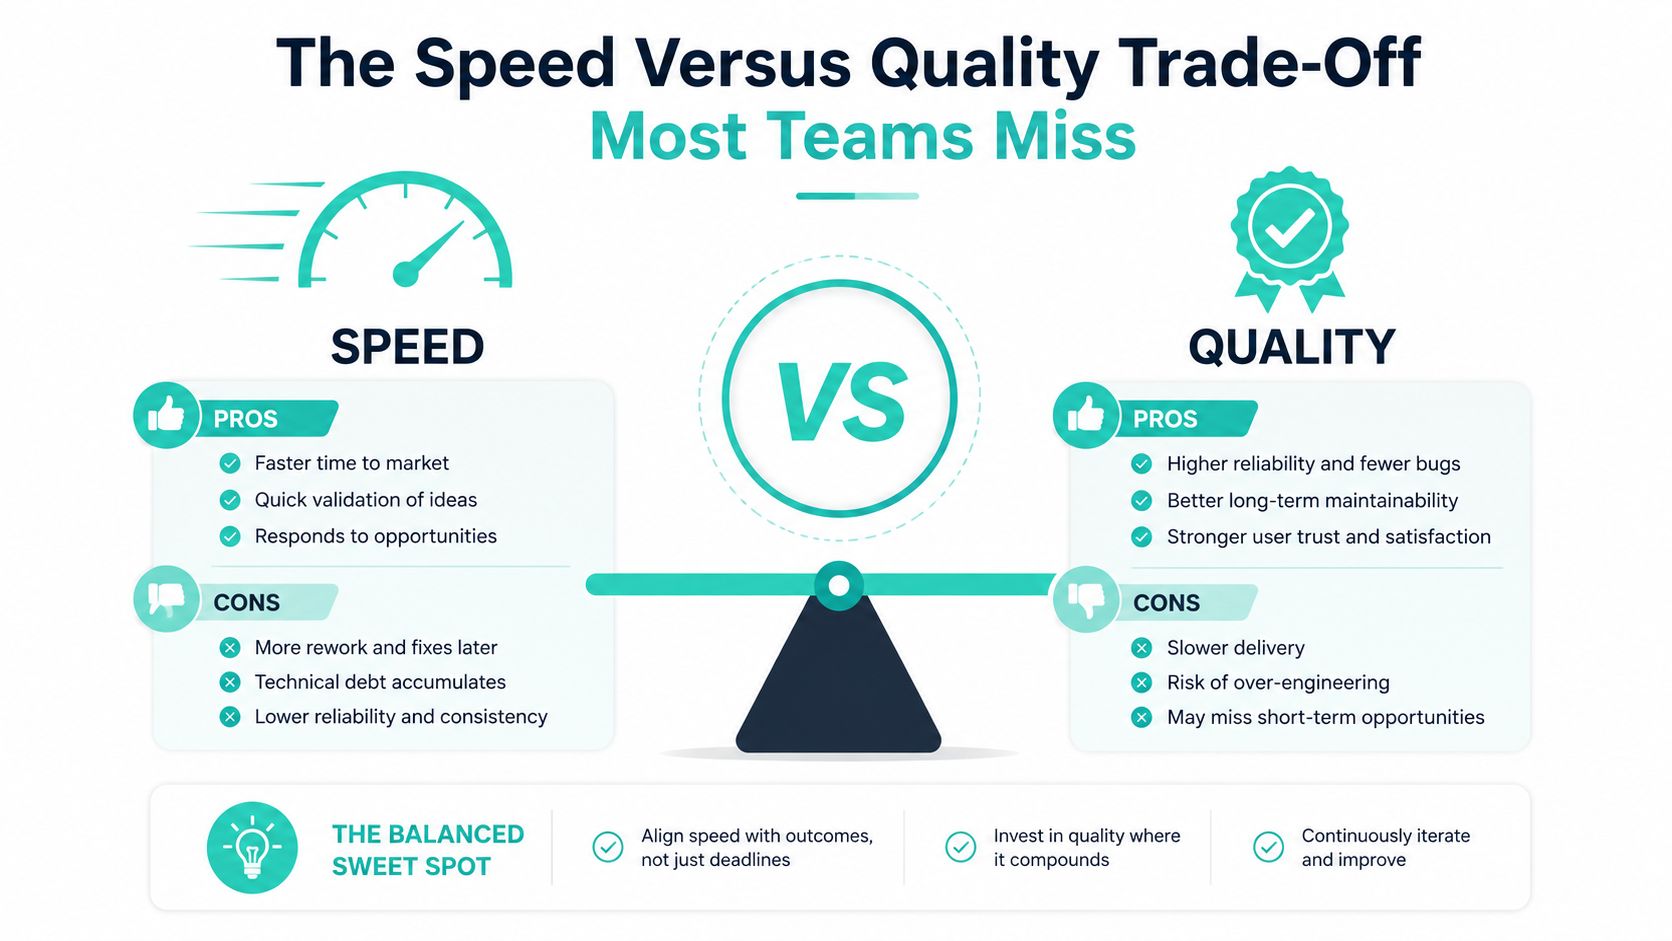
A lot of founders say they want speed, but what they really want is certainty. They want the role filled, the team stable, and the decision to feel clean. The problem is that aggressive speed targets often force recruiters to skip reference checks, compress technical loops, or accept weak signals just to keep the clock moving.
That's a bad trade. A faster process can look efficient while increasing 90-day attrition or lowering the bar on who gets hired. If you only measure time to hire, you can't tell the difference between a strong process and a rushed one. That's why I'd never use the metric alone as a performance target.
The right question isn't “How do we make hiring faster?” It's “How do we make hiring faster without degrading quality?” That means pairing time to hire with first-year retention, stage conversion, and a basic quality-of-hire scorecard. If those downstream signals move the wrong way while speed improves, the process got worse, not better.
Recent guidance from Metaview says trend matters more than a single benchmark and recommends tracking time to hire alongside post-hire outcomes. Join's guidance makes the same core point, time to hire breaks when used alone, so pair it with decision velocity, stage conversion, source yield, and first-year retention. That's the right operating principle for founders. Metaview recruitment analytics guidance
This is the position I'd defend in a leadership meeting:
Do not optimize for the shortest possible hire cycle. Optimize for the fastest cycle that still produces durable hires.
That line keeps the team from turning the metric into a vanity contest. It also gives your head of people permission to push back when a manager wants to rush a senior hire through because the calendar looks bad.
If you need the argument in one sentence, use this, faster isn't better when it increases replacement risk. That's how short-term efficiency becomes long-term drag.
Engineering teams at Series A startups often add interview rounds without measuring whether those rounds predict retention. That is how time to hire gets worse while confidence stays high. Shorten the process by removing handoff friction, tightening decisions, and cutting interview drag that adds no signal.
Tighter intake meetings are the first move. Get the hiring manager, recruiter, and the person who owns budget into one meeting before the role opens. Lock the scorecard, the required skills, the interview plan, and the decision maker. That reduces rework later because nobody is guessing after candidates are already moving through the funnel.
Structured interview kits cut inconsistency and save time. Give interviewers a fixed rubric, a few high-signal questions, and a decision format. Teams that standardize the loop stop re-litigating the basics after every debrief, and candidates get a cleaner experience.
Async take-home replacements work when you are evaluating applied skill, not meeting theater. Use them to replace live exercises that create scheduling bottlenecks, especially for technical roles where coordination overhead is the main delay. If the exercise maps to the actual job, it helps. If it exists to fill a calendar slot, drop it.
Single-threaded recruiter ownership removes confusion. One person should drive the candidate through the process and own follow-up. When ownership is split, nobody owns the clock, and deadlines slide without a clear owner to fix them.
Same-day debrief SLAs matter more than people admit. If the team waits until Friday to discuss Tuesday interviews, momentum is already gone. Give the hiring team a simple rule, decide while the candidate is still warm, and stop letting calendar drift turn into lost offers.
If you only change two things this month, start with intake meetings and debrief SLAs. Those are the fastest path to less drag without redesigning the whole process. If your technical hiring is the bottleneck, swap one live round for an async exercise and measure whether decision velocity improves.
For teams building a deeper outbound engine, Underdog.io's pipeline guidance and cut hiring costs with pipelines both point in the same direction, stop relying on reactive sourcing alone. Better pipelines shorten the front end so your team is not paying for delay later.
The rollout mistake is treating interview kits like a compliance memo. Do not do that. Show hiring managers that the kit saves them time and reduces debate, then ask them to try it on one role before you scale it. If they see better decisions and fewer empty calendar slots, they will keep using it.